This article is an automatic translation.
Analyze your code evolution using Julia
Every time you git commit, you save more than just code: you
save a decision. Over time, those accumulated decisions tell the story of
a project—from which programming languages you use to which ones you
abandoned; which parts grew and which ones died.
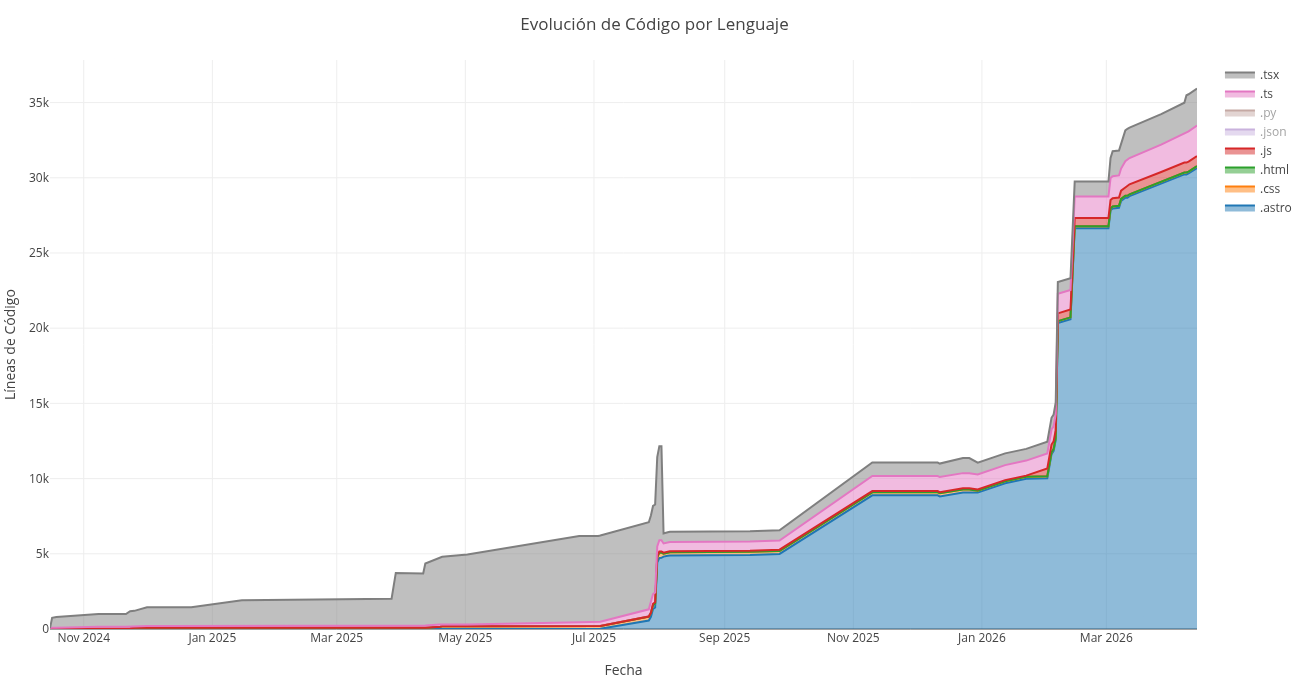
The script I present here reads that history directly from your Git history and turns it into an interactive stacked area chart. For each file extension you're interested in tracking, it calculates net lines commit by commit and accumulates them into a timeline. The result is a browser-ready HTML.
It is written in Julia and doesn't use regex: date detection is purely
positional and extension extraction works with text indices. The result is
a code_evolution.html file generated with PlotlyBase, with unified
hover and dark theme.
using PlotlyBasefunction generate_plotly_evolution()println("Processing Git history...")data_per_ext = Dict{String,Dict{String,Int}}()interest_extensions = Set(["jl", "py", "c", "cpp", "h", "php", "js", "html", "css", "astro", "ts", "tsx", "dart", "rust", "go", "rb", "swift", "kt", "scala", "lua", "r", "sql", "zig", "nim", "elixir", "clj", "cljs", "lisp", "fsharp", "ocaml", "haskell", "groovy", "perl", "vb", "powershell", "bash", "zsh", "fish", "makefile", "dockerfile", "yaml", "json", "xml", "toml"])dates_set = Set{String}()curr_date = ""for line in eachline(pipeline(`git log --pretty=format:%as --numstat`))line = strip(line)isempty(line) && continue# Strict detection without Regex (faster for the CPU)if length(line) == 10 && line[5] == '-' && line[8] == '-'curr_date = linepush!(dates_set, curr_date)continueend# Split only into 3 maximum partsparts = split(line, limit=3)if length(parts) == 3add_str, del_str, file = parts(add_str == "-" || del_str == "-") && continue# Extract the extension using indices instead of Regexidx = findlast('.', file)if idx !== nothing && idx < length(file)ext = lowercase(file[idx+1:end])if ext in interest_extensionsadd = parse(Int, add_str)del = parse(Int, del_str)# Get or create the internal dictionaryd_ext = get!(data_per_ext, ext, Dict{String,Int}())d_ext[curr_date] = get(d_ext, curr_date, 0) + (add - del)endendendendall_dates = sort(collect(dates_set))traces = GenericTrace[]for ext in sort(collect(keys(data_per_ext)))d_ext = data_per_ext[ext]accumulated_series = Int[]sum_val = 0# Fill days using the sorted string arrayfor d in all_datessum_val += get(d_ext, d, 0)push!(accumulated_series, max(0, sum_val))endt = scatter(x=all_dates,y=accumulated_series,mode="lines",stackgroup="one",name=".$ext",fill="tonexty")push!(traces, t)endlayout = Layout(title="Code Evolution by Language",xaxis_title="Date",yaxis_title="Lines of Code",hovermode="x unified",template="plotly_dark")p = Plot(traces, layout)open("code_evolution.html", "w") do ioPlotlyBase.to_html(io, p)endprintln("Ready! 'code_evolution.html' has been created.")endgenerate_plotly_evolution()
Installation
To run this script, you need to install PlotlyBase in Julia.
julia -e 'import Pkg; Pkg.add("PlotlyBase")'
With this, you should be able to run the script and generate code_evolution.html.
This script asume that you are inside a Git repository with a commit history and that you have permissions to run Git commands from the terminal. To run it, you need to write the following command:
julia script.jl
Result Example:
Note that the analysis may fail or take a long time on very large repositories with a history of years or many commits, as it traverses the entire Git history.