✨ CodeCraft Estimator
An AI-powered software project estimator, designed to optimize the planning and budgeting process.
💡 Project Origin
This project was conceived to modernize time estimation in software development. The central idea of time estimation, particularly the weighted average formula for tasks, was inspired by a video from Luisina of TodoCode, using the same calculation logic she presents in her project management methodology.
✨ Main Features
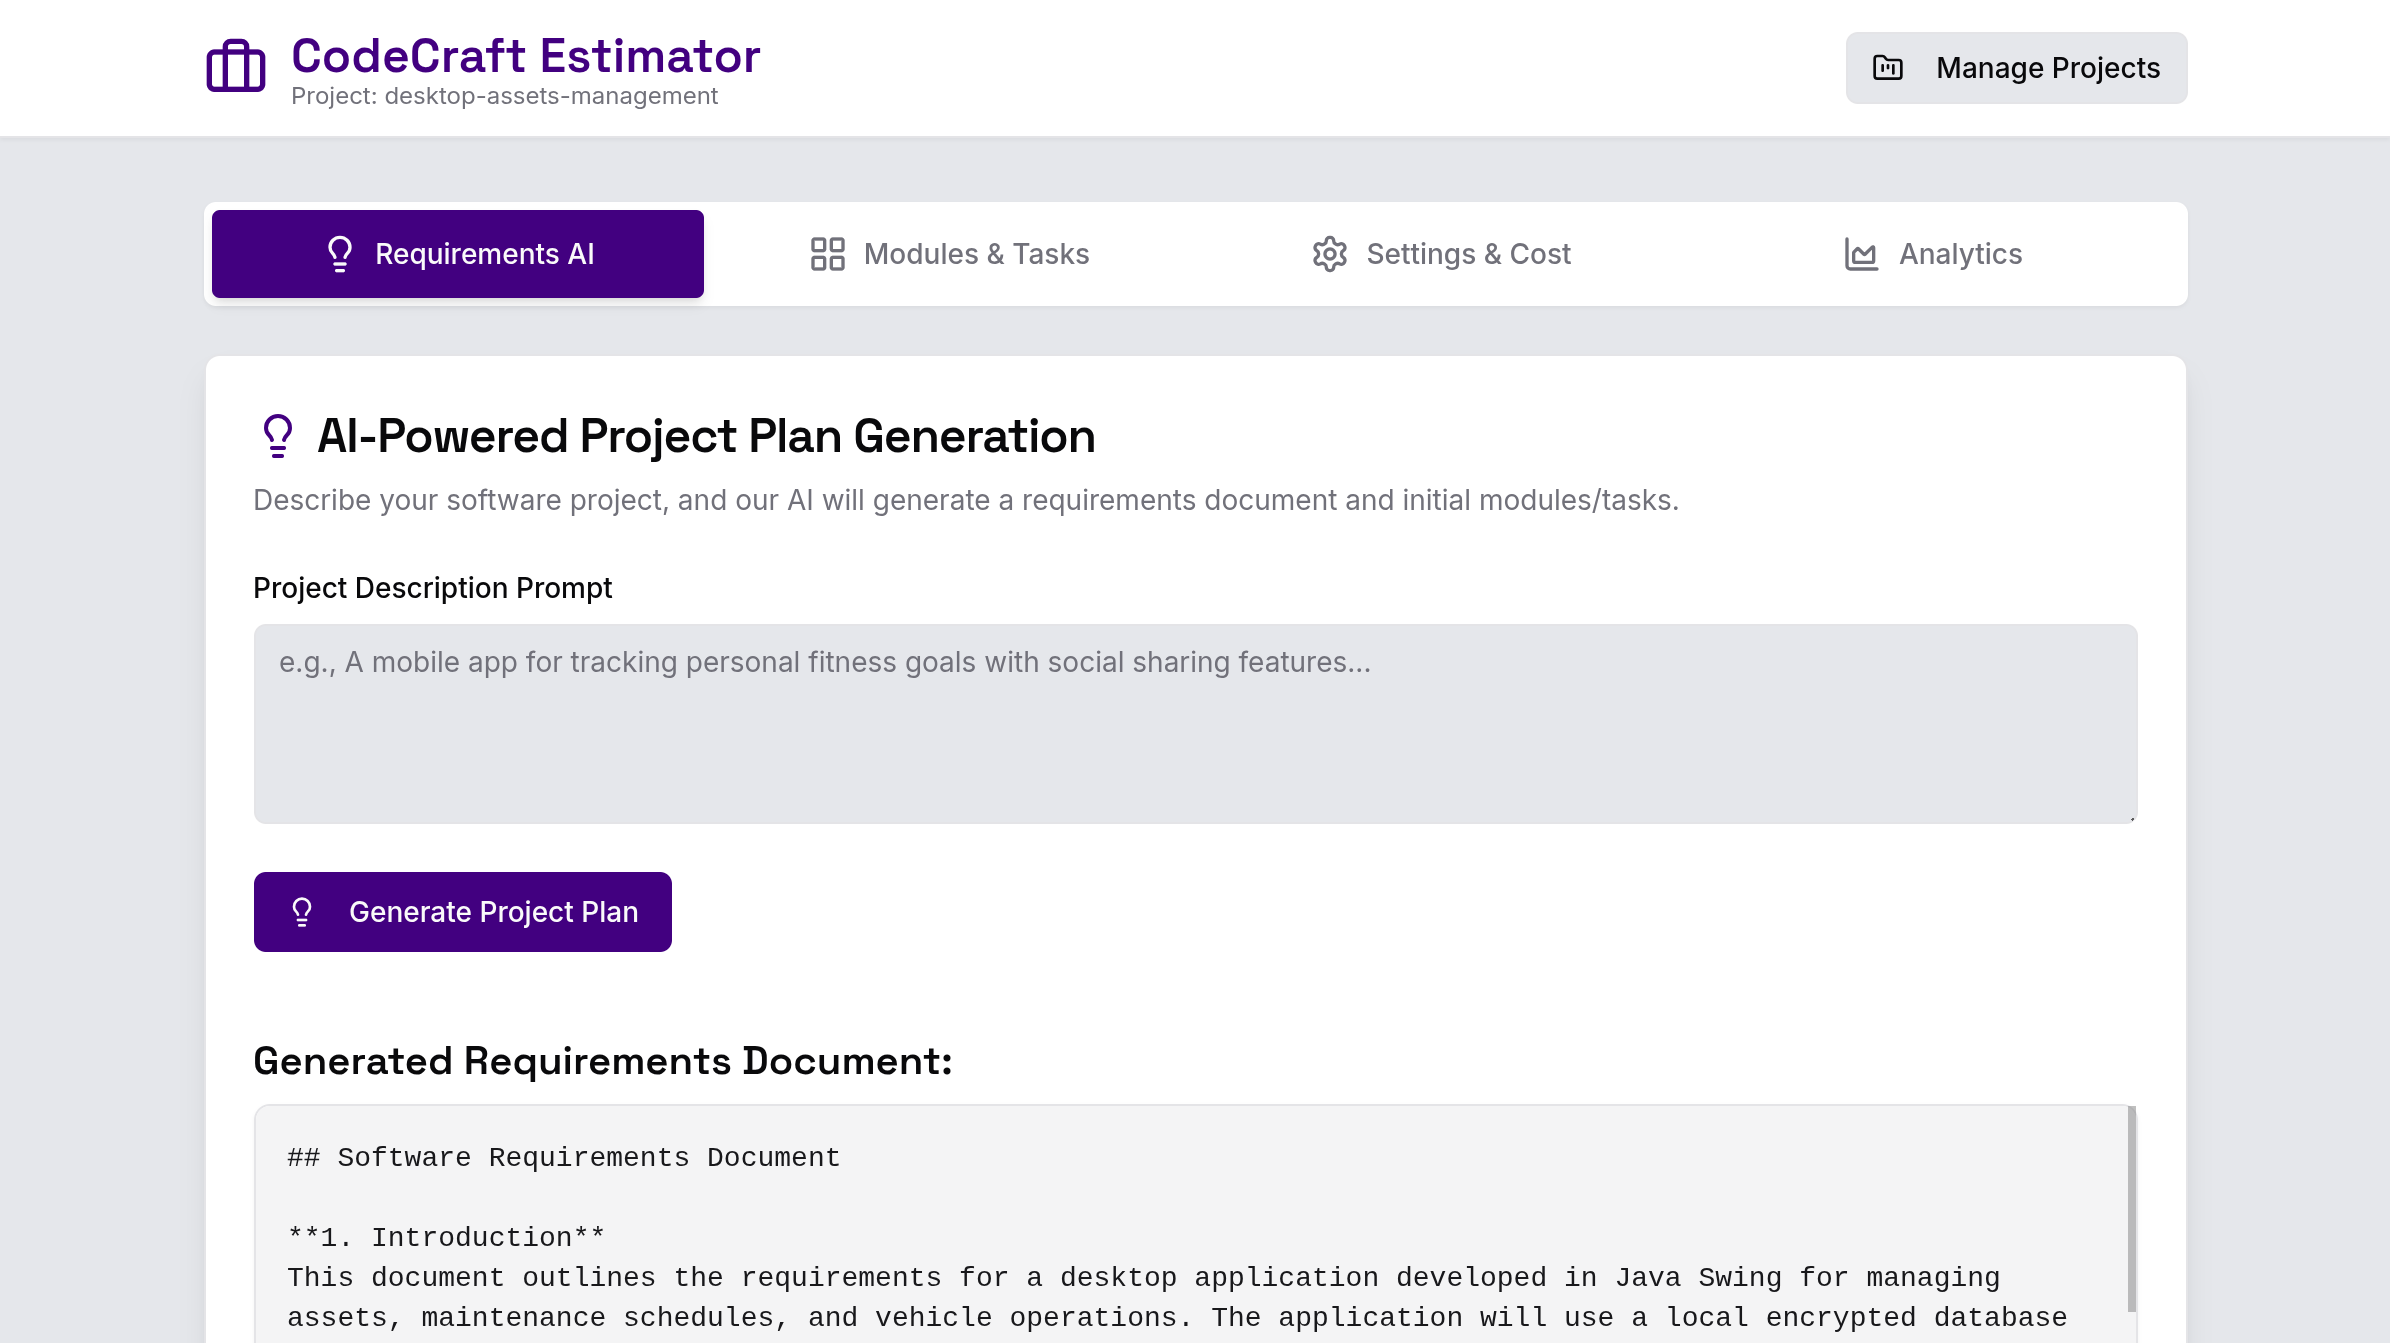
- AI-Powered Requirements Generation: Generates software
requirements documents based on user input, incorporating best
practices for functional, non-functional, security, and deployment
requirements. The LLM decides which details to include or omit based
on the prompt.
- Module Management: Allows users to create, name, and
organize individual project modules to structure the estimation
process.
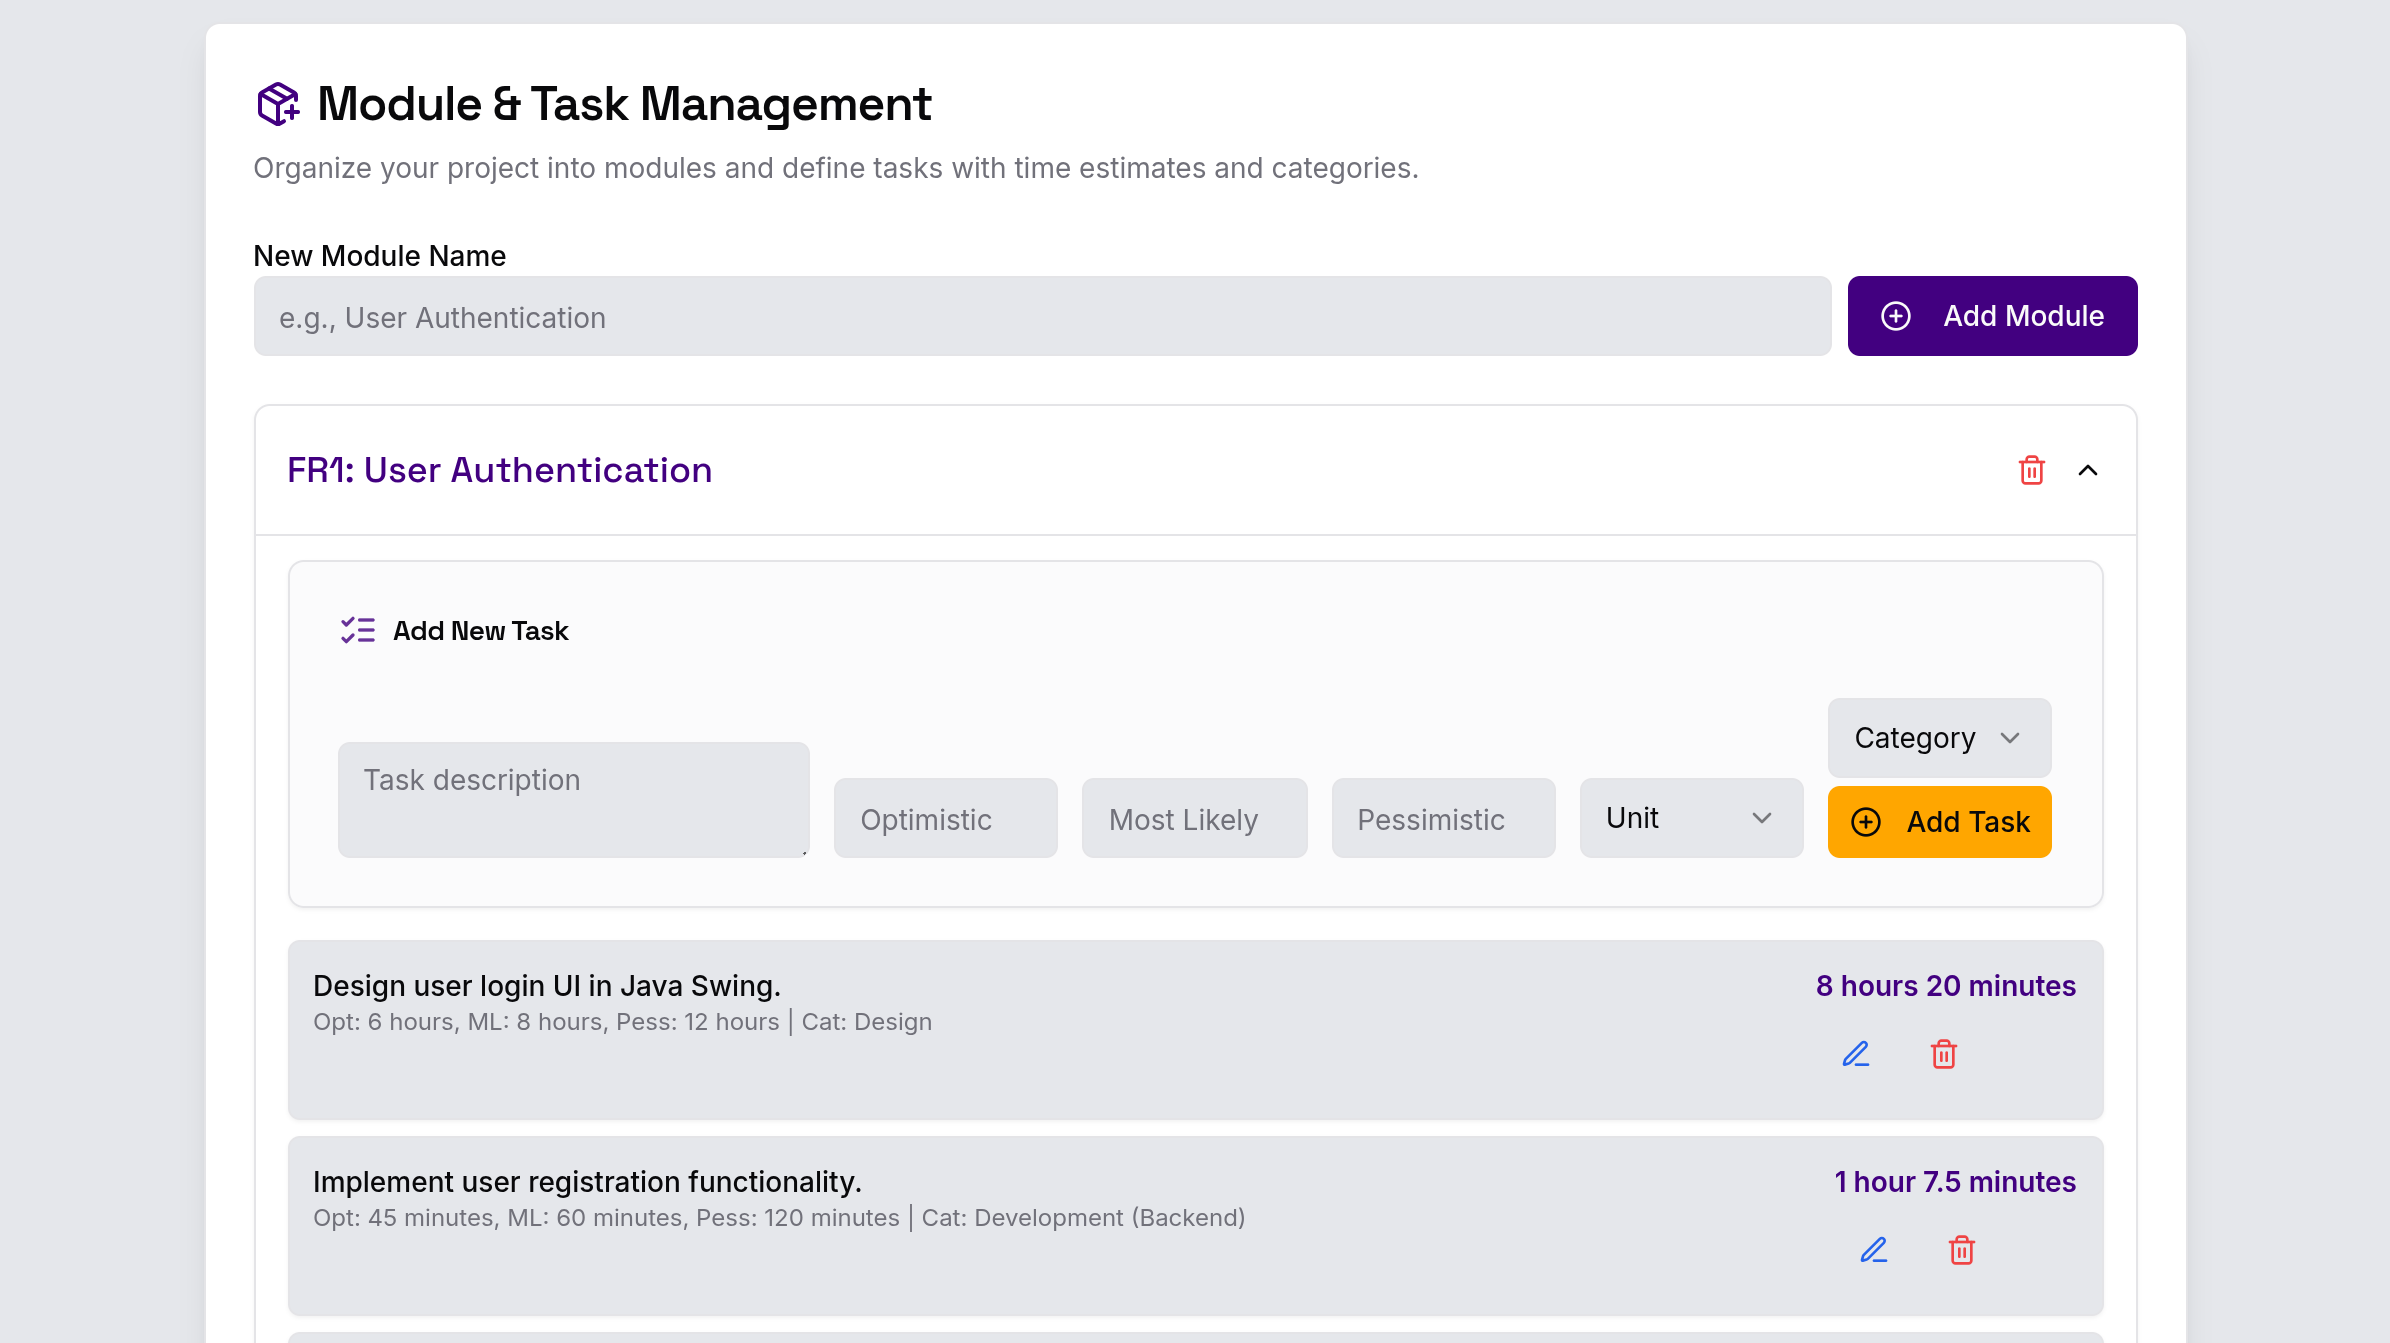
- Manual Task Entry: Enables manual entry of tasks within each module, including optimistic, pessimistic, and most likely time estimates. All estimates are stored as Decimal types and can be entered in minutes, hours, or days.
- Automated Time Calculation: Calculates the weighted
average time for each task using the formula:
- $$t_p$$ Pessimistic Time (highest estimate)
- $$t_m$$ Most Likely Time (most realistic estimate)
- $$t_o$$ Optimistic Time (lowest estimate)
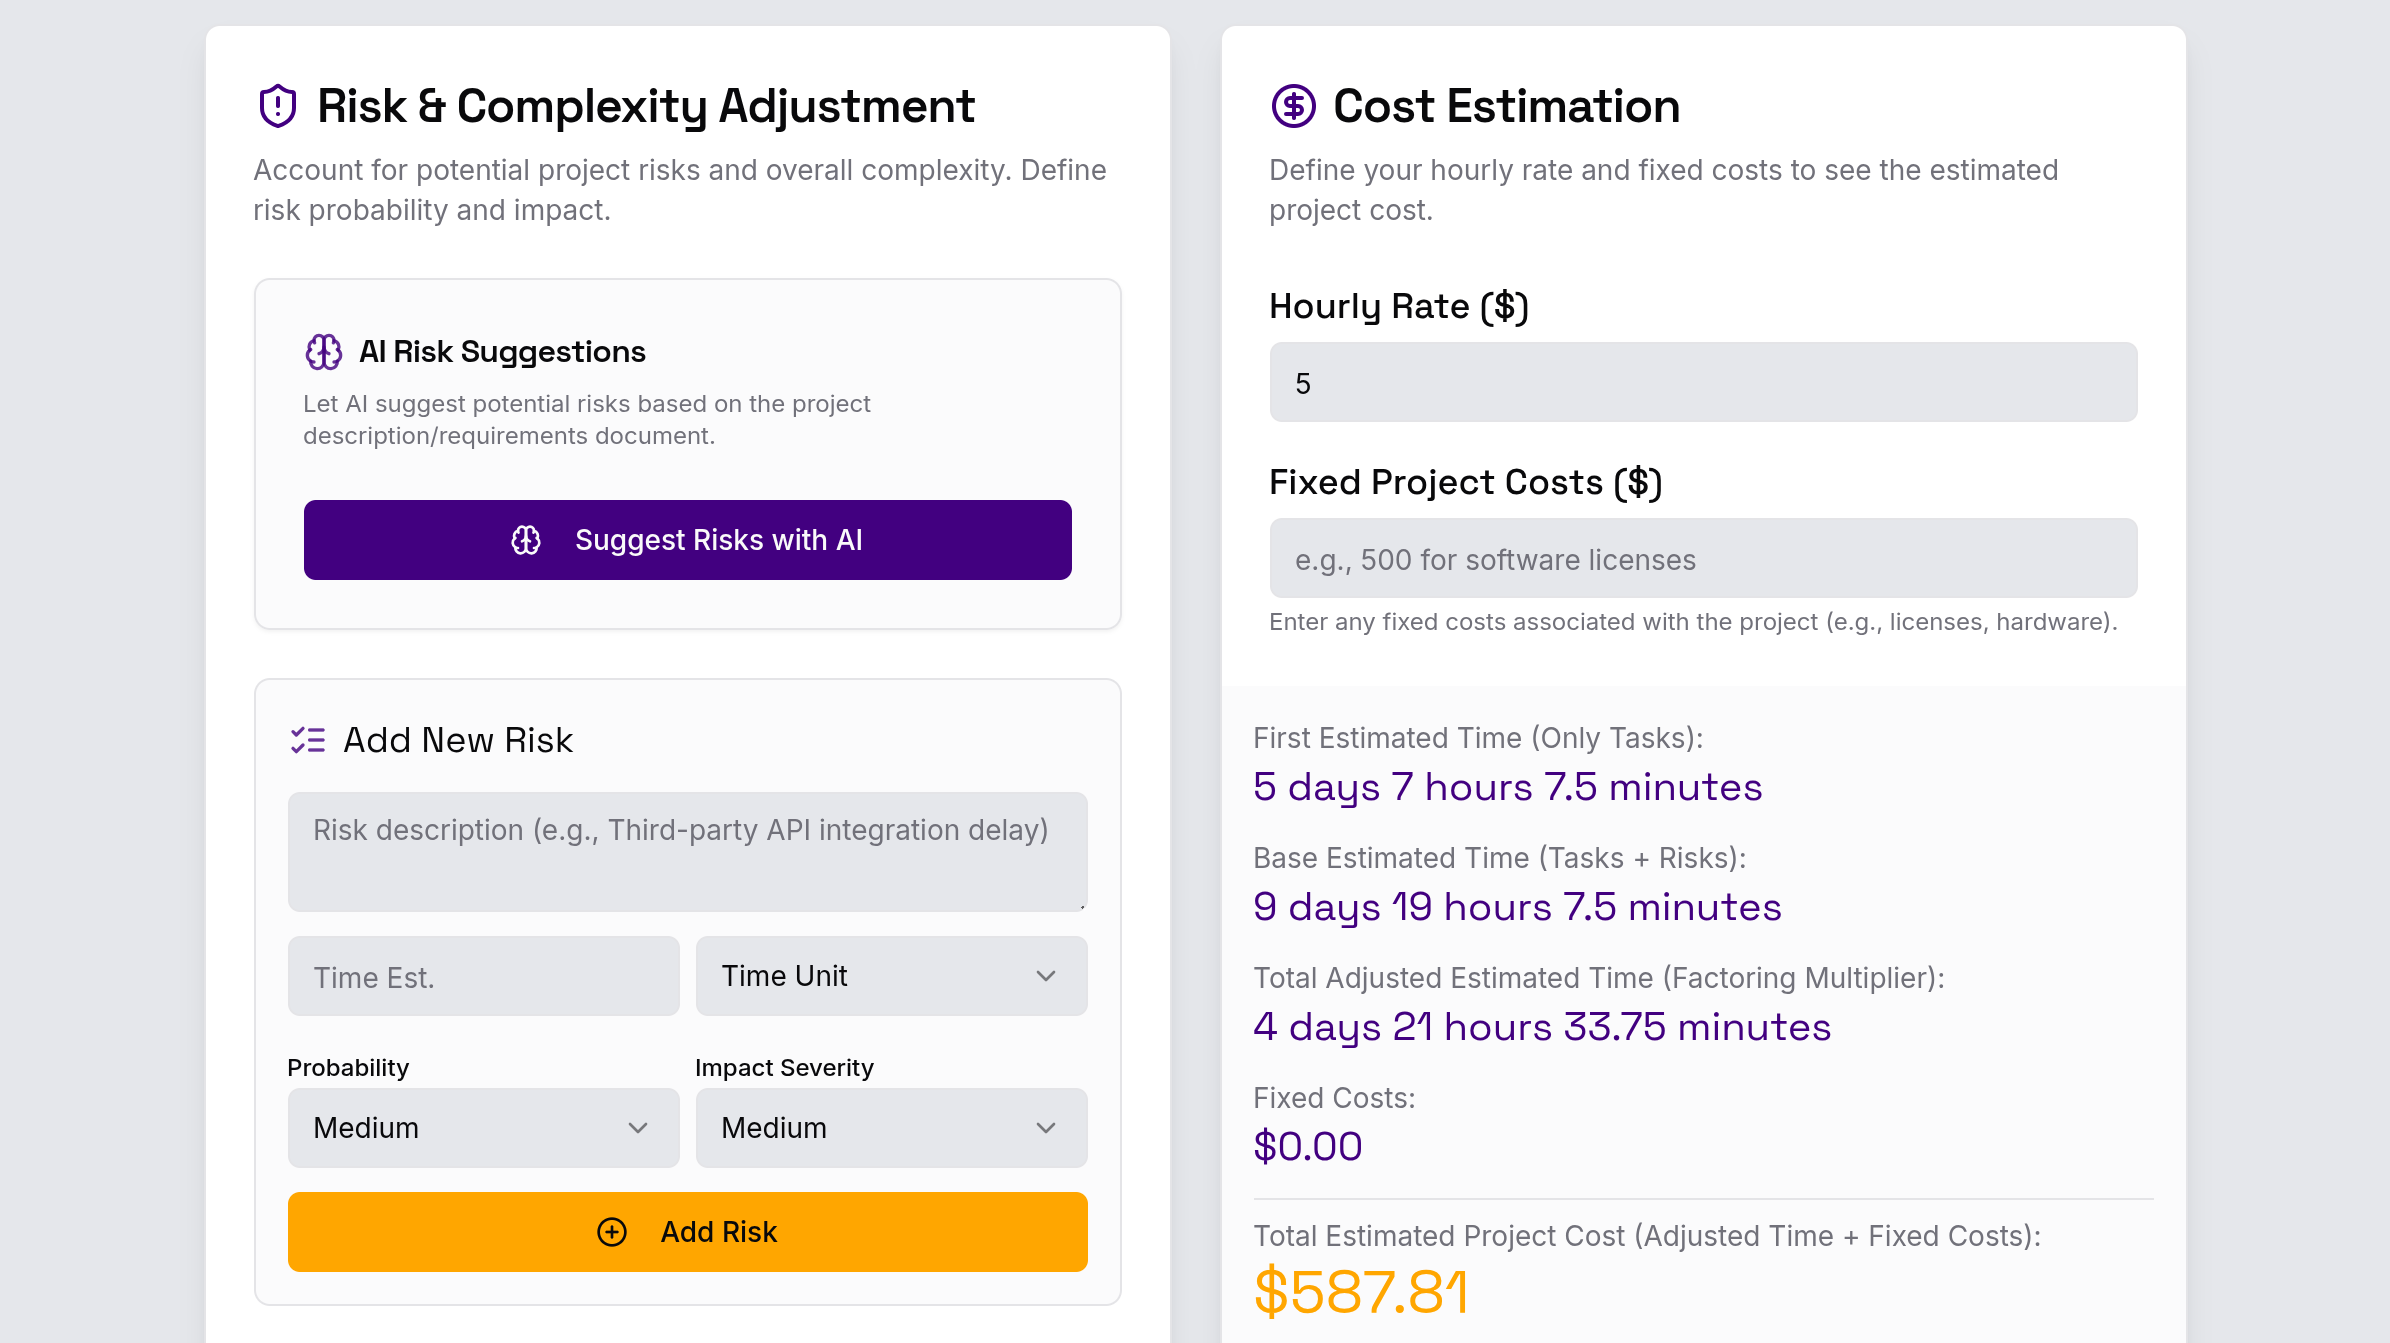
- Risk and Complexity Adjustments: Provides a section to enter potential project risks (with their associated time estimate) and an overall effort multiplier for considerations like security or deployment complexity.
- Time to Cost Conversion: Dynamically converts the
total estimated time to a project cost based on a user-definable
hourly rate. Changes are reflected reactively when any of the time
estimates are adjusted.
- AI-Powered Task Augmentation: Allows the user to enter a prompt to add more tasks to the current module and adjust task times. The LLM decides if the task suggestions can improve project delivery.
- Estimate Export: Allows exporting time and cost estimates to a JSON file for later use or for sharing with other stakeholders.
- Statistics and graphs: Generates visual project
statistics, including bar and line charts showing the distribution of
estimated time per module.
